JC / Railbird

Mine That Bump

Kentucky Derby 2009 bump chart, from Charts and Graphs:
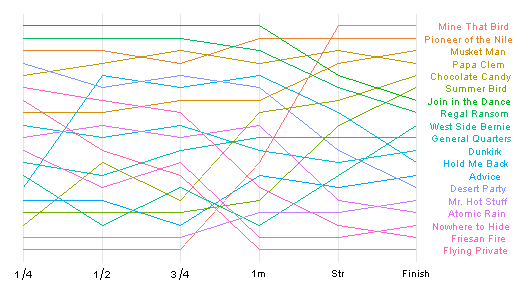
2009 Kentucky Derby bump chart done in R

Created with ggplot2 for R. More from Learning R on its construction.

Mine That Bird’s rail dash looks no less improbable graphed, while Pioneerof the Nile’s even run looks better. Too bad there’s no Trakus data, which would make for a busier, but surely richer and more revealing, chart.


11 Comments

Musket Man, Chocolate Candy & Summer Bird’s look great! West Side Bernie’s doesn’t look too bad either. Very cool!

Posted by dana on May 11, 2009 @ 10:19 pm

There is no excuse for Churchill Downs to leave the guesswork to the chartman for beaten length comparisons.

That in a 19 horse field, no less.

Trakus is used by Keeneland, Del Mar, Woodbine with great interest by those seeking accuracy. Yet in 2009, we run some of the greatest races during the calendar year
at this track without precision measurements.

This must be corrected by Mr. Evans staff.

Posted by The_Knight_Sky on May 12, 2009 @ 10:37 am

A Trakus chart would give you the same information as ye olde racing chart….except the dubious ‘distance traveled’ stat, about as useless as a pitcher’s W/L is in baseball.

Posted by o_crunk on May 12, 2009 @ 7:49 pm

o’ crunk … in a nutshell that would be true if the graph was set to give a summarization of the relative positions of the horses, which this chart does.

However those positions of the horses can (and do) change while the chartman was judging the distances of the horses moving elsewhere in the race, perhaps 16th – 17th – 18th. So what we’re seeing on the graph, may not really be true.

Every horse is moving forward or moving backwards relative to each other during the chartman’s sketching of the details with his assistant. As a result the lead horse may be accurate at the half-mile pole but when the rear horses are scrutinized … the race is already in the 5th furlong.

Think of it, we require measurements of the races in 1/100ths of a second, yet many racetracks still do not provide the precise position on the racetrack at the point of call. Furthermore it absurd for a racetrack like Churchill Downs to conduct their marquee race in such imprecise fashion in the modern era.

Posted by The_Knight_Sky on May 13, 2009 @ 9:09 am

I understand what you’re saying but at that point of measure the best ‘graph’ is just to pull up the replay and watch the race yourself.

Trakus is hugely underwhelming considering what it could do in light of what it actually does. Keeneland got a lot accolades for instituing it from the tech crowd, then basically used the data it’s spitting out in all the wrong ways wrapped around old ideas of information display.

I agree with you on point of call position, my biggest beef with tracks and info – just get your damn teletimer on point, show me your runup, show me any changes you make to your clocks. Transparency. It’s a lot more than a bunch of radios and chicklets.

Posted by o_crunk on May 13, 2009 @ 10:19 am

Definitely, o-crunk. No decent track should have chicklets on its screen during a live race. A replay, I can understand, but if you don’t want us to look at the HORSES while the race is going on, then you’re in the wrong business.

Posted by John S. on May 14, 2009 @ 12:04 am

One more thing: To the Knight Sky

You have never been around the chartcallers that work the maryland tracks, one who was flown to Kentucky to work the Derby. You should thank your lucky stars it is not expensive to pay for their information. Their work is better than Trakus in the same way a handcrafted watch is better than one made by machine. They are professionals in the finest sense of the word.

Posted by John S. on May 14, 2009 @ 12:09 am

John S. wrote:

Their work is better than Trakus in the same way a handcrafted watch is better than one made by machine.

They are professionals in the finest sense of the word.

———————-

I’m sure the Maryland chartcallers are quite worthy of your praise. But for the average joe looking at past performances from race to race and from track to track, he has little knowledge who actually compiled the chart.

Did the chartcaller do it or his assistant? Did either one of them have a dentist appointment that day? Or did Equibase hire some guy who delivers the donuts in the press box.

The public is not privy to these people. WHO IS DOING THE JOB? That is a very important item to note when studying the past performance data. Trakus introduces a constant of reliability.

Posted by The_Knight_Sky on May 14, 2009 @ 10:34 am

Let me know when Trakus can call a troubled trip, a stumbled start, a lug in, pinched break, squeezed 3/8 etc.

I’m all for what Trakus *could* be but let’s be real here for a second – there’s no way you’re trading your real chart for a Trakus chart at this stage of the game. No way.

Go take a look at the KEE website with all the trakus charts and data – it’s miles behind ye olde racing chart.

Posted by o_crunk on May 14, 2009 @ 11:13 am

There are different elements, o’ Crunk.

Let’s not confuse real data in which can be measured via teletimer and GPS chips.

And data with which a chartman is most useful, in trying to convey with words into the chartman’s comments. A peaceful harmony can exist between the old and the new.

Posted by The_Knight_Sky on May 14, 2009 @ 2:18 pm

“A peaceful harmony can exist between the old and the new.”

Nicely put. It’s not a matter of Trakus or chartcallers, it’s how to take the best of data and craft to get a more complete and nuanced view of each race.

Posted by Jessica on May 15, 2009 @ 11:10 am